This post may contain affiliate links. If you click a link and make a purchase, I may earn a commission at no additional cost to you. As an Amazon Associate, I earn from qualifying purchases. I’m not affiliated with Airbnb in any way (other than being an Airbnb host, of course). Read my full disclosure policy here.
As an Airbnb Superhost, I use AirDNA every week. It’s an essential tool to optimize my nightly rate, understand if a potential Airbnb investment would be profitable, and maximize my Airbnb revenue.
AirDNA’s easy-to-use data and insights platform, MarketMinder, provides some of the best short-term rental analytics in the world at a very reasonable price.
Below, I’m walking you through 5 ways AirDNA helps Airbnb hosts optimize their revenue and build profitable Airbnb businesses.
Want to try AirDNA for yourself? (for free!)
Enter a city or address below to instantly get your free revenue forecast:
Contents
5 Ways to Maximize Your Airbnb Revenue
Before we jump in, I want to clarify one thing: AirDNA’s analytics platform is actually called MarketMinder. So, you’ll see “MarketMinder” everywhere on the AirDNA website (that’s good, it means you’re in the right place!)
1. Make the Best Real Estate Investment
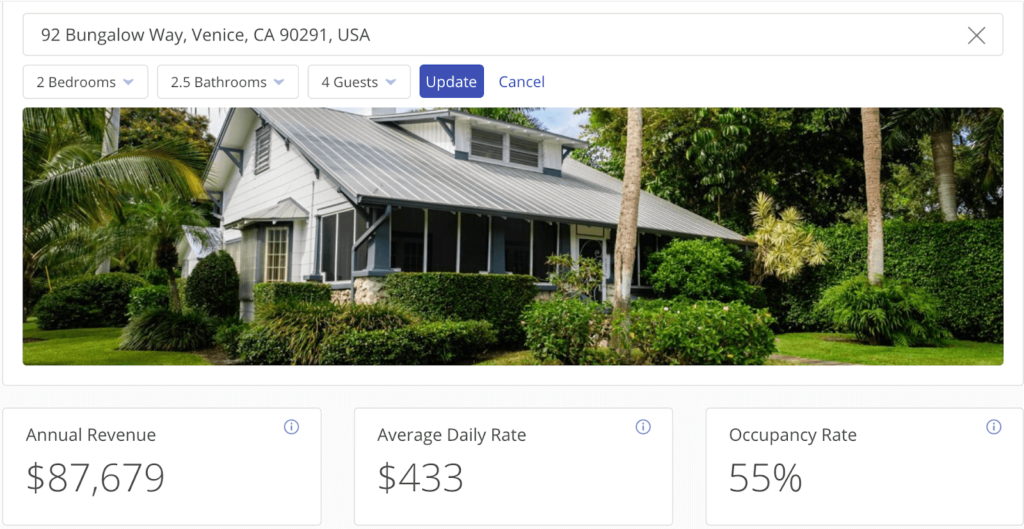
With AirDNA’s Rentalizer tool, you can enter any address in the world to quickly access annual revenue, average daily rate (ADR), and occupancy rate projections.
Best of all, the results you get are based on historical data, competitor indexes, and market revenue growth expectations.
Explore the Retalizer tool by creating a free account here.
Here’s the type of data you get with Rentalizer:
Pro tip: AirDNA aside, one of the best things you can do to maximize your revenue is optimize your listing.
2. Smart Rates (Nightly Rate Forecasting)
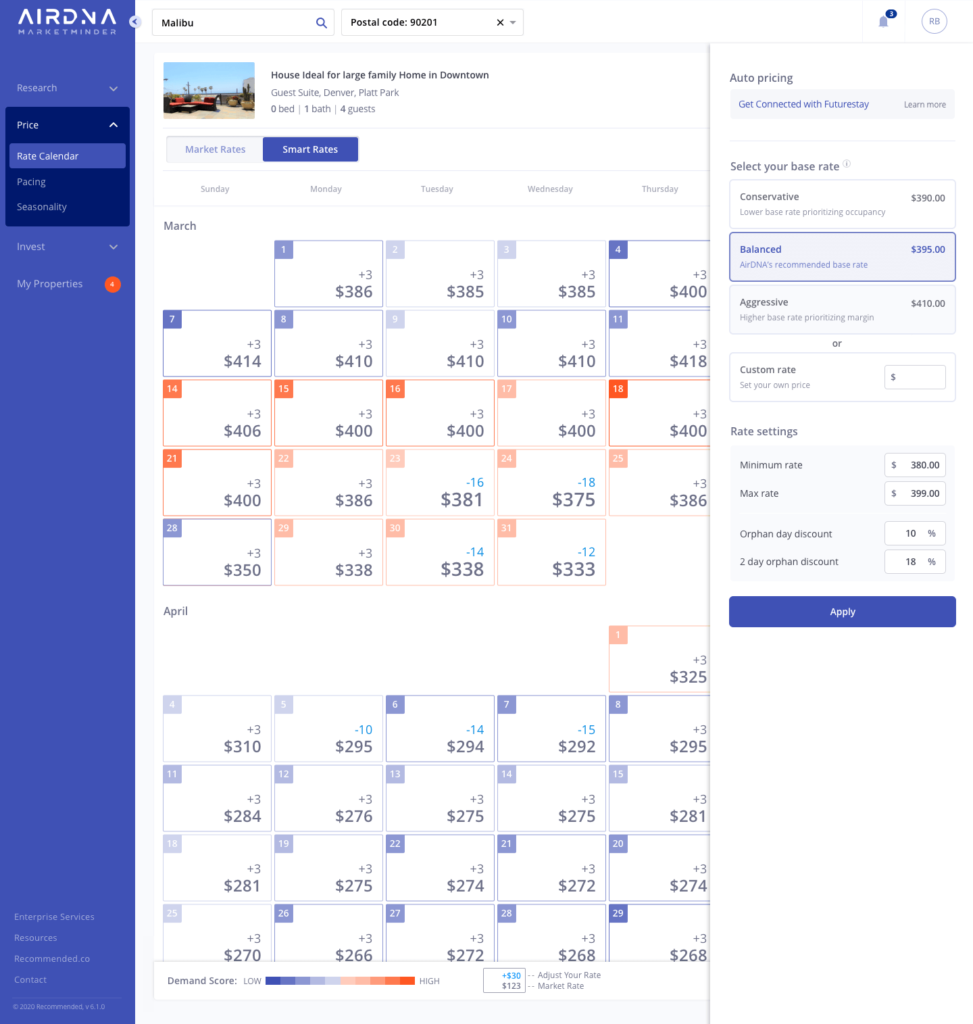
You can also use MarketMinder to access personalized, dynamic pricing recommendations for your Airbnb property.
AirDNA’s Smart Rates helps you maximize your Airbnb revenue by recommending nightly rates based on your Airbnb’s location, comps, and booking trends.
Sync your Airbnb listing here to get started with Smart Rates.
In my opinion, the Smart Rates feature is by far the most helpful tool within MarketMinder because it’s so easy to use. (And, let’s be honest, determining your pricing on Airbnb is one of the hardest parts about hosting. I’ll take all the help I can get!)
You can even customize Smart Rates suggestions to be more or less aggressive, depending on what you think is best for your property (I change this setting month-by-month, depending on seasonality.)
Here’s what you’ll see inside Smart Rates:
Pro tip: Pricing is just one of the 50+ ways your listing can be optimized today to start earning you more revenue today!
3. Understand Future Travel Demand
With AirDNA’s Pacing Tools, you can see real-time demand in your area for the next six months.
This forward-looking data provides you with insight into comparable occupancy rates, bookings, and year-over-year comparisons to help you make better-informed decisions about your business today and prepare for how your business will change in the future.
You can even hover over any date to get a rate analysis for your market.
Try out AirDNA’s Pacing Tools for yourself!
Here’s a look at AirDNA’s Future Demand Analysis chart, one of three interactive Pacing Tools you get with AirDNA:

4. Assess Travel Seasonality
We all know that COVID-19 changed how Airbnb guests travel.
And that, with or without COVID-19, the amount guests travel has always changed depending on the time of year.
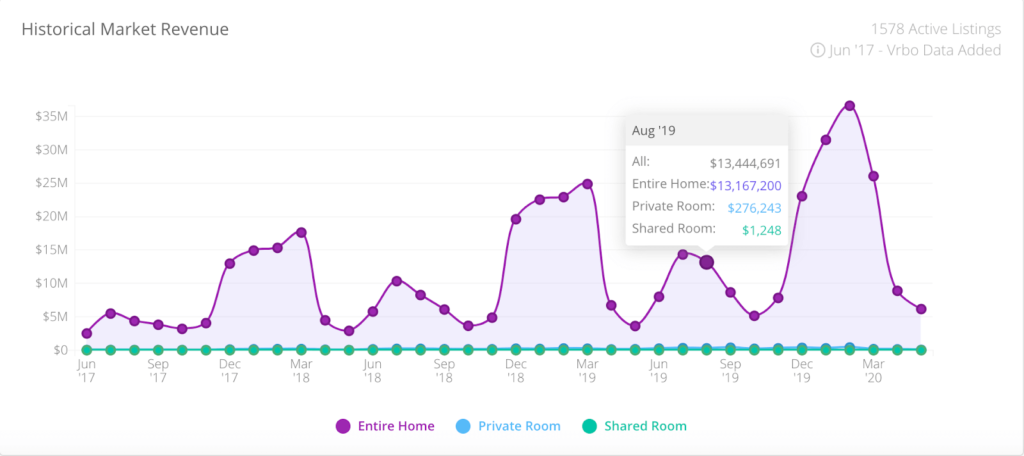
Thankfully, AirDNA has historical data dating back to 2017 so that you can see what trends are like in your area.
As an Airbnb host, you can use this data to understand trends you’re seeing today and inform your future expectations for your business.
You can even see the changes in booking trends month-to-month and year-over-year:
5. Research Your Competitors
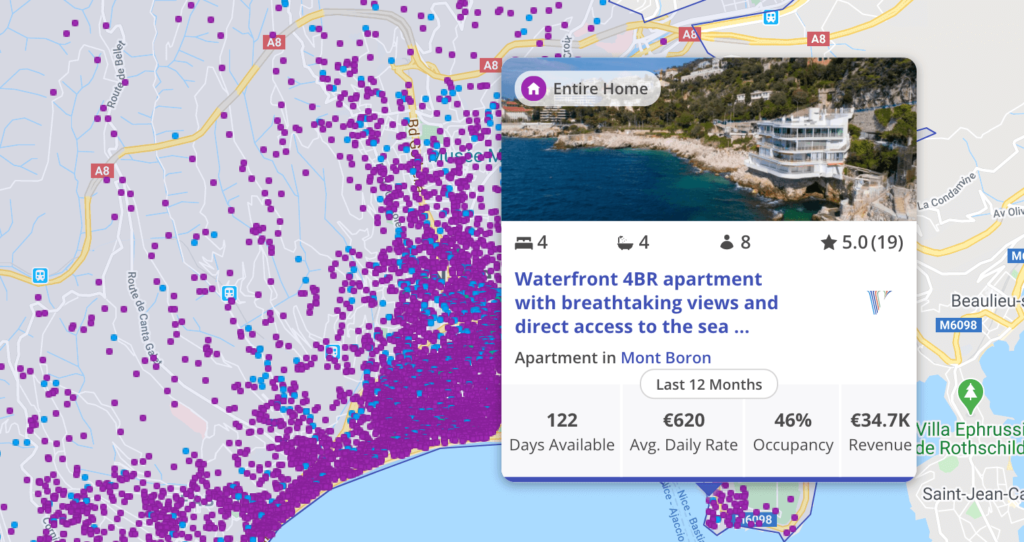
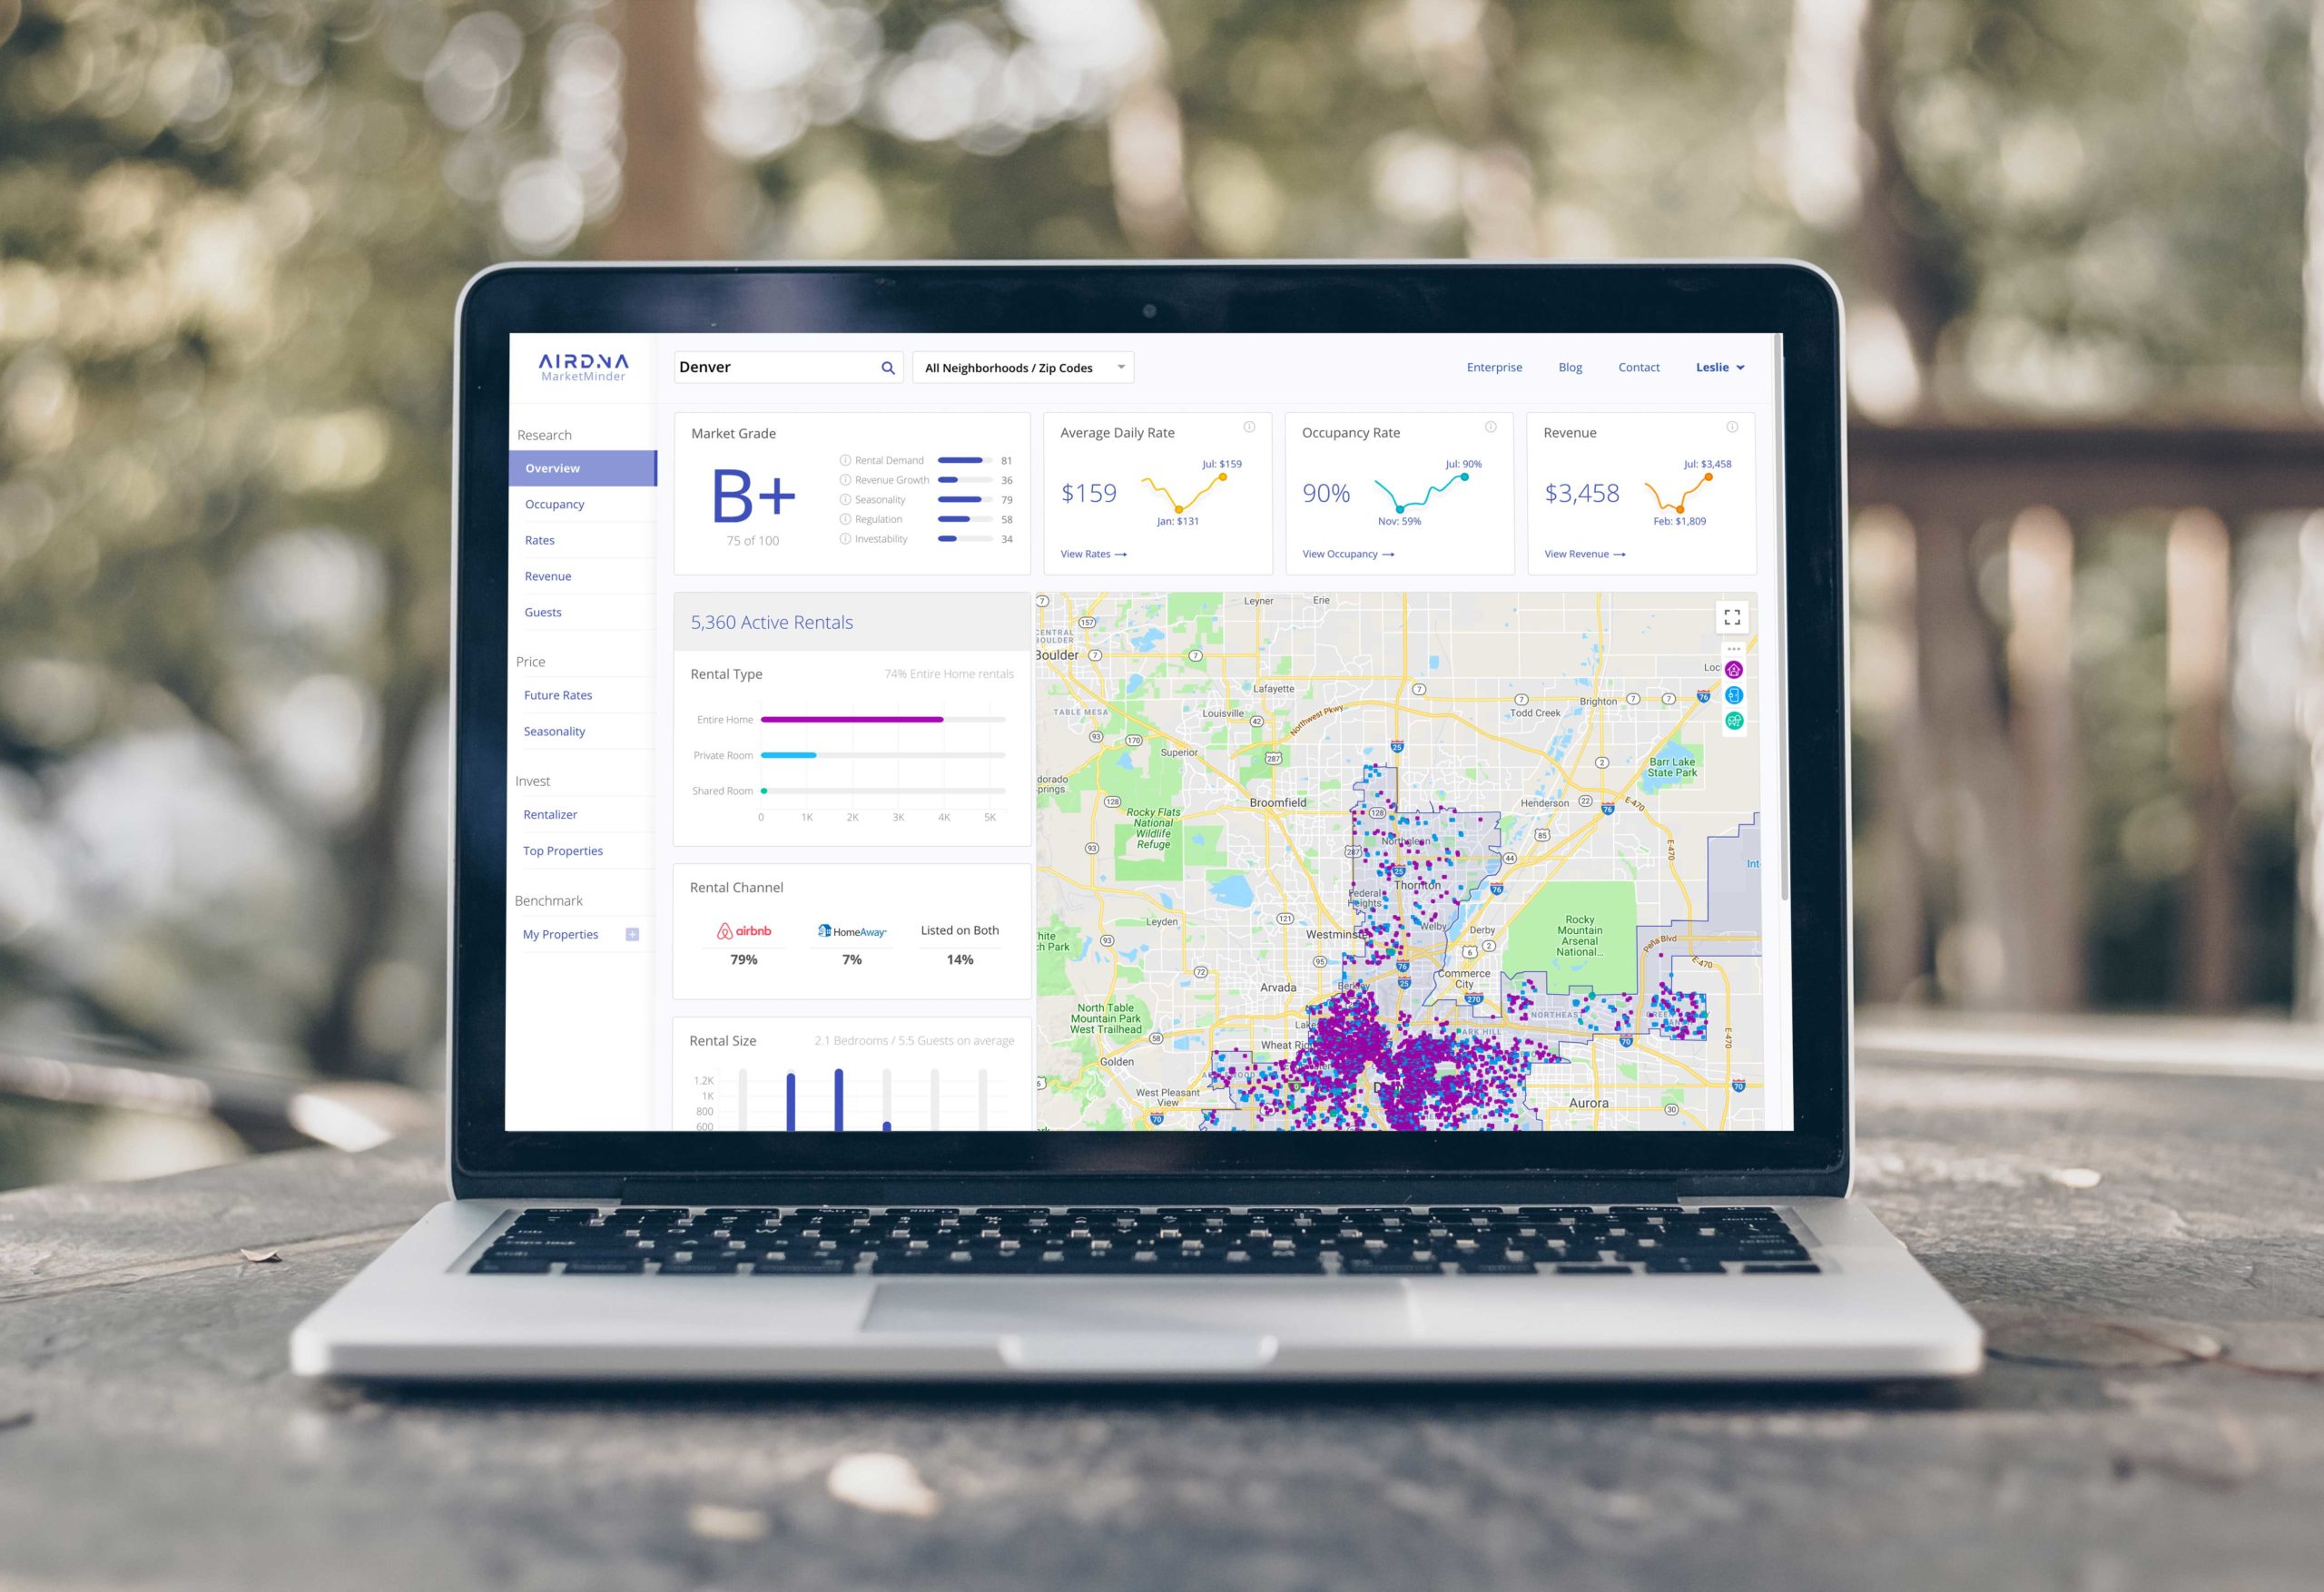
AirDNA’s Overview tab is packed with data to help you quickly research comparable properties in your area.
By hovering over any property on the interactive map in the Overview tab, you can see what your neighbors are doing and benchmark against your competitors.
The Overview tab will also show you how many rentals are active in the market, how many listings get added or removed each quarter, and booking trend data so you can set yourself apart from the competition.
Go ahead, take a peek!
Get 40% Off Your AirDNA Subscription
Want 40% off your AirDNA MarketMinder subscription?
Have any questions about AirDNA? Let me know in the comments
Don’t forget! Save this post for later:
Disclaimer: All content on this website is for informational purposes only. You are taking all provided information at your own risk. We are not financial, real estate, legal, investment or other professionals. Nothing on this website should be construed as professional advice. We will not be liable for any loss or damage of any nature. For more information, read our disclaimer.
+ show Comments
- Hide Comments
add a comment