


Airbnb hosts look no further – you’ve just found the most comprehensive list of Airbnb statistics all hosts need to know.
Understanding the data below before creating or optimizing your Airbnb listing will ensure you’re creating a compelling listing based on what guests care about most in 2022.
Read on for 100 of the latest Airbnb statistics. I’m covering everything from whether or not the Airbnb market is oversaturated to how COVID-19 has changed guest priorities. You’ll also learn the best locations to have an Airbnb in 2022 and how Airbnb demand is expected to change this year.
Let’s jump in.
This post may contain affiliate links. If you click a link and make a purchase, I may earn a commission at no additional cost to you. As an Amazon Associate, I earn from qualifying purchases. I’m not affiliated with Airbnb in any way (other than being an Airbnb host, of course). Read my full disclosure policy here.
Contents
- Is Airbnb oversaturated?
- How much do Airbnb hosts make?
- How has COVID-19 impacted bookings?
- Has COVID-19 changed guest priorities?
- Do we expect these trends to continue in 2022?
- How has the Omicron variant impacted bookings?
- Why do travelers choose Airbnb?
- How do these Airbnb statistics change by region?
- What are the most popular U.S. destinations?
- What are the demographics of Airbnb users and guests?
- Who is becoming an Airbnb host?
- Are most Airbnb hosts Superhosts?
- How is the Airbnb platform performing?
- What’s the future of Airbnb?
- Takeaway
- Sources
Is Airbnb oversaturated?
With over 5.6 million Airbnb listings worldwide and more than 4 million hosts, you might be wondering if the market for new Airbnbs is oversaturated.
Here’s what you need to know:
- There are over 5.6 million Airbnb listings worldwide (Airbnb)
- And more than 4 million Airbnb hosts on the platform (Airbnb)
- 100,000 cities and towns have Airbnb listings (Airbnb)
- 220+ countries and regions have Airbnb properties (Airbnb)
- There are 660,000 active listings in the United States alone (iProperty Management)
- Nearly 2 million listings are available to potential guests at any given time (Much Needed)
While Airbnb supply is high, demand is even higher:
- Over 4 billion guests have stayed in an Airbnb since inception (Airbnb)
- 800 million stays have been booked worldwide by 150 million users on the platform (iProperty Management)
- 6 guests check into an Airbnb listing every second on average (iProperty Management)
- 33.9 million U.S. adults were using the Airbnb platform in 2017 (+4.9 million compared to 2016). That number is expected to rise to 45.6 million in 2022 (Statista)
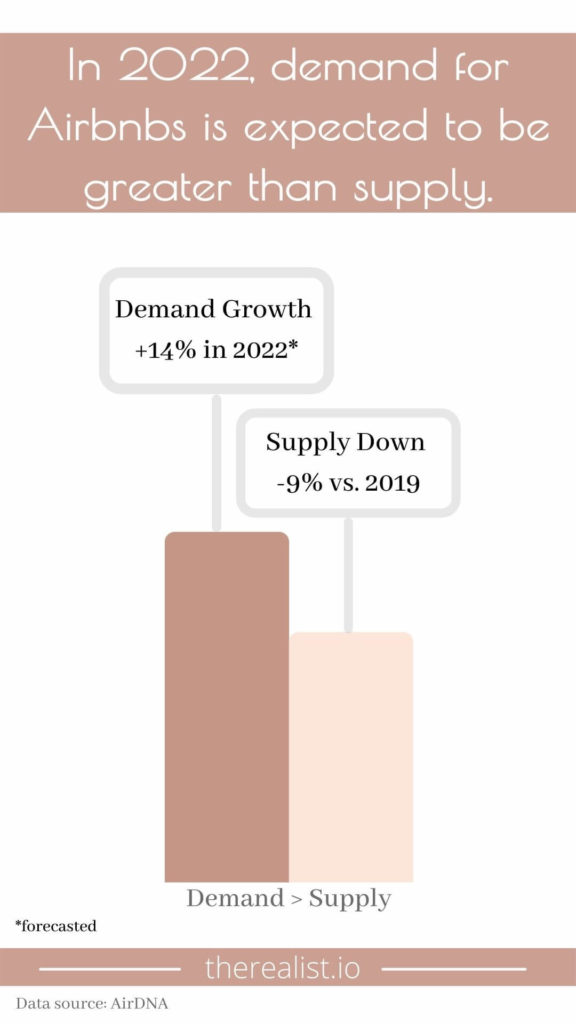
Therefore, the market isn’t oversaturated. There’s room for overall growth on Airbnb:
- In 2022, demand is expected to be up +14.1% vs. 2021 (AirDNA)
- At the same time, the number of available listings is still -9% below 2019 levels (AirDNA)
- Growth will need to come from either more listings or higher occupancy of existing listings (AirDNA)
Recommended: What to Expect Your First Month as a New Airbnb Host
How much do Airbnb hosts make?
The amount Airbnb hosts make varies widely.
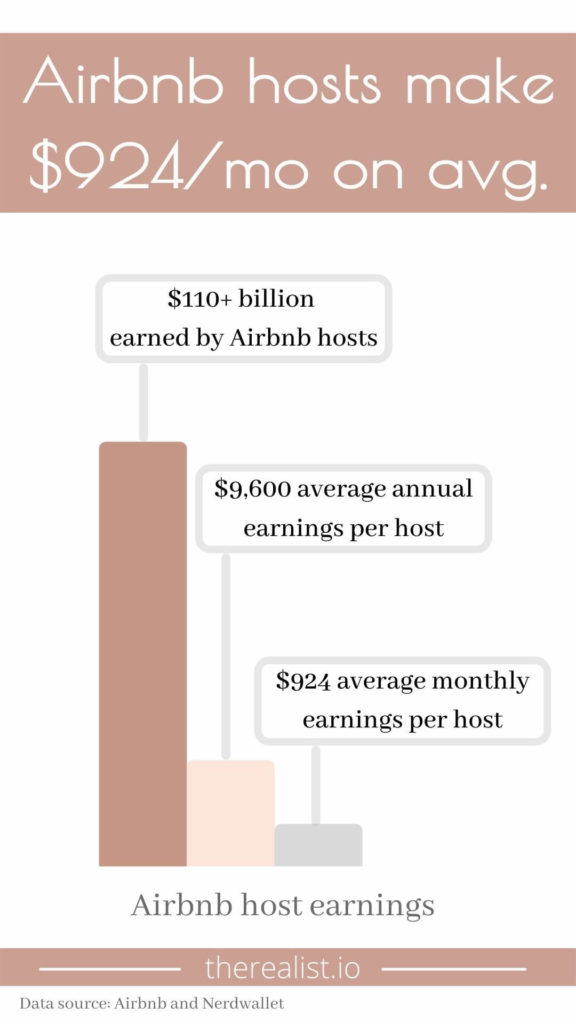
On average, Airbnb hosts earn $924 per month, with many hosts making six figures or more per year:
- To date, Airbnb hosts have collectively earned $110+ billion (Airbnb)
- Hosts earn $9,600 annually, on average (Airbnb)
- That comes out to $924 average monthly earnings per host (Nerdwallet)
- While the average monthly revenue isn’t high enough for a full-time business, some Airbnb hosts have created a six-figure income through their Airbnb business (Nerdwallet)
- The nightly rate hosts receive is $185 on average (iProperty Management)
- The average occupancy rate is 48% (iProperty Management)
- On average, 81% of an Airbnb host’s rent can be covered by Airbnb bookings (for a two-bedroom home) (Much Needed)
- In some cities that number’s even higher – like in Miami, San Diego, Philadelphia, and Chicago where on average 90% of total rent can be covered by Airbnb bookings (Stratos Jets)
- On a given night, 11% of U.S. listings are reserved (Much Needed)
- Airbnb Experience hosts earn an average of $10,000 annually (iProperty Management)
How has COVID-19 impacted bookings?
COVID-19 has drastically changed bookings on Airbnb and we’re now seeing high-season extend well into what was previously considered off-season (or ‘shoulder season’).
COVID-19 has drastically changed the length of stays:
- The average length of an Airbnb booking is 4.3 nights (iProperty Management)
- Compared to a hotel, Airbnb guests stay 2.4x longer in an Airbnb, on average (Hospitable)
- ~45% of bookings are for one week or more (compared to just 38% in 2019) (Airbnb)
- 53% say they’ll travel more “in the spur of the moment” (Airbnb survey)
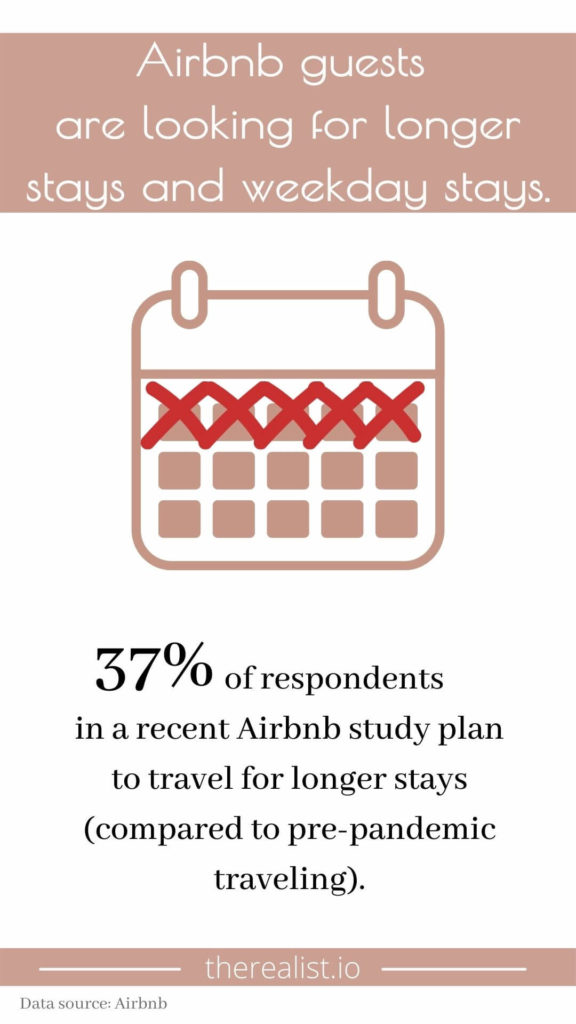
- 37% of respondents plan to travel for longer stays (Airbnb survey)
- 20% of nights book on Airbnb between July and September 2021 were for at least one month (Airbnb)
- Guests in 2021 spent more on longer stays than any other time in Airbnb history (Airbnb)
- 100,000+ guests in 2021 stayed in one or more Airbnbs continuously for 3+ months (Airbnb)
- We’re seeing +33% increase in long weekend stays (3-4 days) compared to 2019 (Airbnb)
The pandemic also impacted when guests plan to travel:
- 55% of respondents in a recent Airbnb survey say they plan to travel more during off-peak times (Airbnb survey)
- 55% of respondents in that same Airbnb survey expect to travel more over long weekends (Airbnb survey)
- Even families are traveling more during the week – with the most growth in stays happening on Monday and Tuesday nights (Airbnb)
- One third of travelers surveyed said that after the pandemic, they’d like to live somewhere else and work remotely more often (Airbnb survey)
Recommended: 6 Proven Tactics to Increase Airbnb Revenue
Has COVID-19 changed guest priorities?
Given the increase in remote work brought on by the pandemic, guests are prioritizing more work-from-home amenities.
- Guests are seeking out wifi, workspaces, and pet-friendly Airbnbs. The most-searched amenities over the past several months were: 1) pets-allowed, 2) pools, 3) wifi, 4) kitchens, and 5) free parking (Airbnb)
- These priorities are a meaningful change compared to 2019, when the top five most-searched amenities were 1) pools, 2) wifi, 3) kitchens, 4) air conditioning, and 5) pets-allowed (Airbnb)
- We’re seeing a +55% increase in searches that filtered for allowing pets (Airbnb). I believe this is because people are staying for longer and working remotely, so they want to bring their pets along more often than if they’re just escaping for the weekend
- Listings with laptop-friendly workspaces are up +73% (Airbnb)
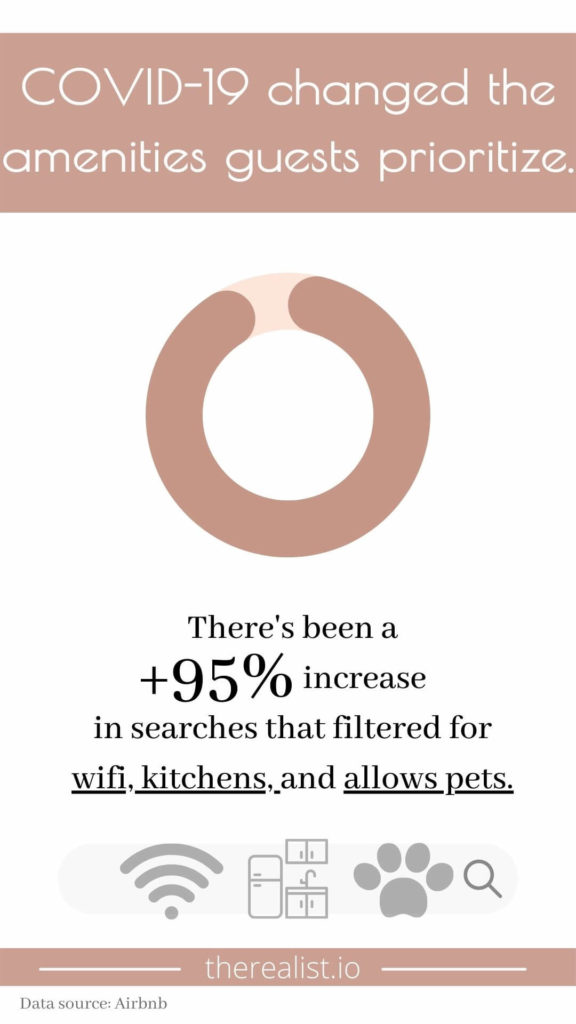
- And it’s not just one amenity that guests want – searches filtered for wifi, kitchens, and allows pets are up +95% (Airbnb)
- Moreover, companies seem to be supporting the ability for their employees to work remotely; 400,000 companies manage travel for their employees with Airbnb (iProperty Management)
Airbnb Host Tip: consider highlighting the above amenities in your own listing. This will ensure you’re appealing to what today’s guests are looking for!
These Airbnb statistics are even more pronounced for longer-term stays:
- For longer-term stays, the biggest shift in amenity priority are wifi and pets-allowed. The most-searched amenities for long-term stays were: 1) wifi, 2) pets-allowed, 3) kitchens, and 4) washer/dryers (Airbnb)
- Again, we’re seeing a meaningful shift vs. 2019, when the top searched-for amenities were 1) kitchens, 2) wifi, 3) air conditioning, 4) washer/dryers, followed by 5) pets-allowed (Airbnb)
- Long-term stay searches for listings that allow pets has jumped up +128% (Airbnb)
- Long-term stay searches for listings with both wifi and pets is up +270% (Airbnb)
Do we expect these trends to continue in 2022?
So far, we’re seeing the above trends continue into 2022. The following Airbnb statistics are based on bookings for 2022 (as of September 30, 2021).
- Long-term stays are growing faster than any other trip length (Airbnb)
- Family stays are growing faster than any other trip type (Airbnb)
- 71% of those surveyed are in the process of booking (or are considering traveling) within the next year (Airbnb survey)
How has the Omicron variant impacted bookings?
Omicron has stunted Airbnb growth a bit.
- Before news about the Omicron variant broke on November 26, 2021 we had three weeks of demand growing 20%+. With the onset of the Omicron variant, the average has dropped down to just under 10% growth in the past two weeks. This is similar to the impact the Delta variant had, where growth slowed for a few weeks but didn’t have much of a long-term impact on overall demand growth (AirDNA)
- At the same time, the average daily rate (ADR) for stays around the 2021 holidays has increased. The ADR for Christmas and New Year’s are both up +28% compared to 2019 (AirDNA)
Why do travelers choose Airbnb?
Most Airbnb users choose the platform because of its convenience and desire to live like a local.
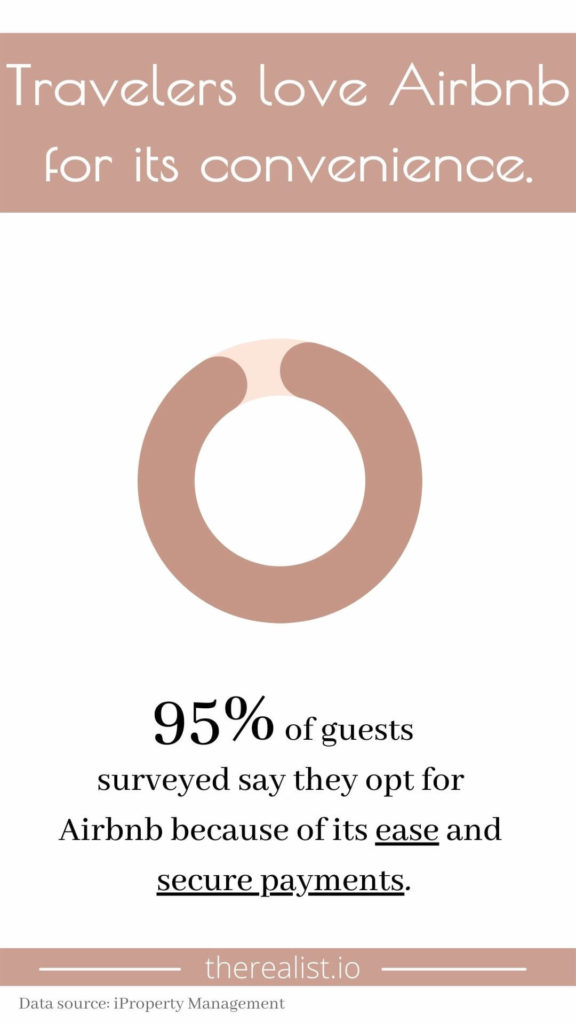
Here are 10 reasons why travelers prefer the Airbnb platform:
- 95% of guests surveyed say they opt for Airbnb because of its ease and secure payments (iProperty Management)
- 86% surveyed say that the location of the Airbnbs they choose is more convenient that a hotel (iProperty Management)
- 77% choose Airbnb because they want their experience to more like that of a local (iProperty Management)
- 64% of respondents feel that home-sharing is more environmentally friendly or ecological (iProperty Management)
- 43% value functionality more than any other amenity (iProperty Management)
- 58% of millennials choose to stay in Airbnbs because of their “social media worthiness”, which is said to be a major factor in booking decisions (iProperty Management)
- 53% of guests choose Airbnb because of the price (Much Needed)
- Airbnb can be as much as 6-17% cheaper than hotels in some U.S. markets (iProperty Management)
- 93% of users reported being satisfied with Airbnb’s service (Much Needed)
- Guests also seem to prefer Airbnb because of the variety of properties available. In December 2019:
- 2,574 guests stayed in castles
- 1,031 stayed in treehouses
- 121 stayed in windmills (iProperty Management)
Recommended: Why Relying on Airbnb Pricing Tools Will Cost You Thousands of Dollars
How do these Airbnb statistics change by region?
Some amenity priorities differ depending on the location, some do not.
- Air conditioning is generally preferred over wifi, though to a lesser extent in some countries: 59% of U.S. guests prefer air conditioning over wifi, while only 46% of Australian guests and 39% of Italian guests have the same preference (iProperty Management)
- Free parking tends to be preferred over a pool by American, Australian, and Canadian guests (iProperty Management)
- Airbnb’s competitive pricing (as compared to hotels) remains true in Europe where the average daily rate of an Airbnb is typically 8%-17% cheaper than that of a hotel (iProperty Management)
What are the most popular U.S. destinations?
If your Airbnb property is in one of these popular destinations, you’re in great shape.
- With 660,000 listings, the United States has more listings than any other country (Stratos Jets)
- In 2020, local stays (those within 300 miles) were booked the most (The Zebra)
- In spring and summer 2021, the most popular U.S. destinations included (The Zebra):
- Southern Maine
- Cape May, NJ
- Round Top, TX
- Lake Powell, AZ
- Cape San Blas, FL
- Orderville, UT
- Mammoth Cave, KY
- Kitty Hawk, NC
- Lake of the Ozarks, MO
- Whitefish, MT
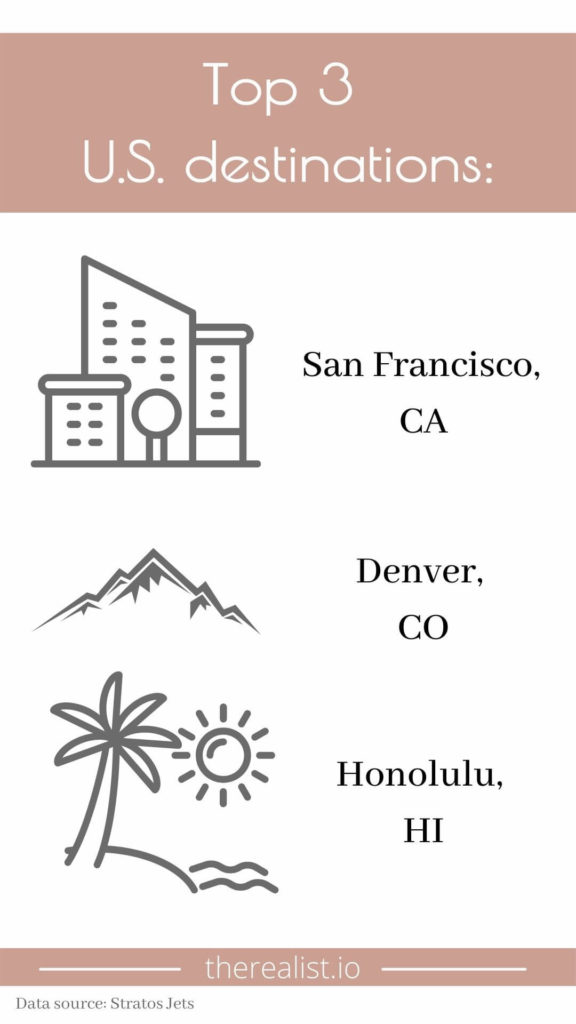
- The U.S. cities with the highest occupancy rates include (Stratos Jets):
- San Francisco, CA
- Denver, CO
- Honolulu, HI
- Kihei, HI
- Los Angeles, CA
- Portland, OR
- San Jose, CA
- Seattle, WA
- Lahaina, HI
- Washington, VA
- New York City, NY
- Boston, MA
- Davenport, IA
- San Diego, CA
- Jersey City, NJ
- Kissimmee, FL
- Salt Lake City, UT
- Panama City Beach, FL
- Tampa, FL
- Dallas, TX
- In San Francisco, the average length of a stay is 5.5 days, costing $1,045 (Much Needed)
- Park City, UT has the highest nightly pricing at $458 per night (Stratos jets)
- Even though San Francisco has the highest occupancy rates, Santa Rosa Beach is the destination with the highest profit per year (Stratos Jets)
- Worldwide, the most popular cities for Airbnb guests are Tokyo, New York City, and Paris (Much Needed)
What are the demographics of Airbnb users and guests?
Most Airbnb users are millennials.
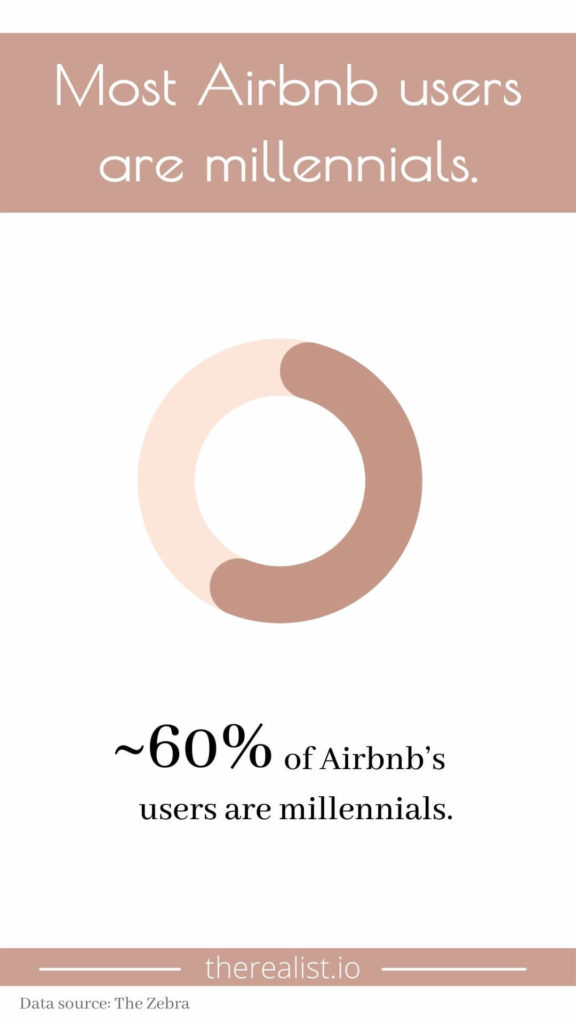
- ~60% of Airbnb’s users are millennials (The Zebra)
- 54% of guests that book through Airbnb are female (iProperty Management)
- 36% of Airbnb guests are between 25-34 years old (iProperty Management)
- 15% of guests are 18-24 years old (iProperty Management)
- 13% of guests are 55+ years old (iProperty Management)
- 88% of bookings are for 2-4 guests (Much Needed)
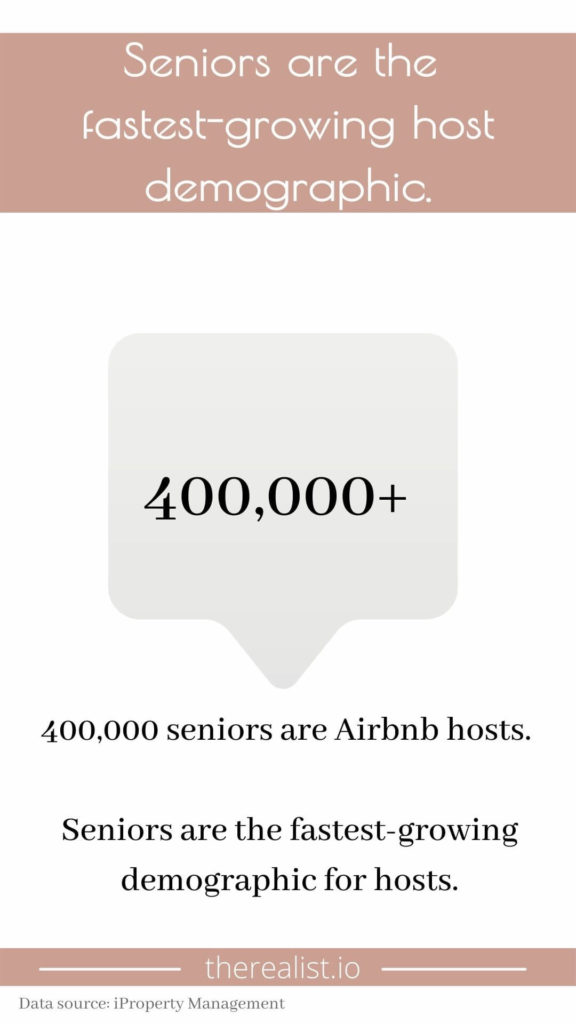
Who is becoming an Airbnb host?
Satisfied guests are becoming Airbnb hosts! Read on to uncover other Airbnb statistics about your host counterparts.
- 22% of hosts said they decided to become an Airbnb host after being a guest on the platform (iProperty Management)
- 400,000+ seniors are Airbnb hosts and seniors are the fastest-growing demographics for hosts (iProperty Management)
- 320,000 hosts 60 years or older earned an astounding $747 million hosting on Airbnb in 2016 (iProperty Management)
- 56% of hosts are female, earning $32 billion since inception ($4 billion annually) (iProperty Management)
- Female hosts in Iceland tend to earn more than anywhere else, bringing in 29% higher income on average (iProperty Management)
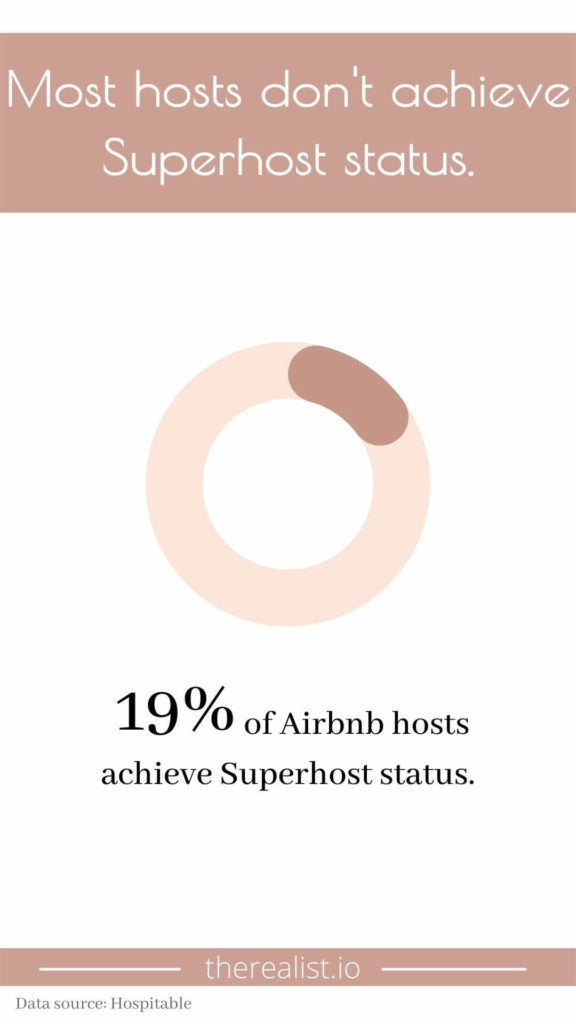
Are most Airbnb hosts Superhosts?
The short answer is – no, it’s hard to achieve Airbnb Superhost status.
- 399,000 U.S. Airbnb hosts were Superhosts in December 29 (The Zebra)
- 19.4% of Airbnb hosts achieve Superhost status (Hospitable)
- 57% of hosts were unable to achieve Superhost status because they didn’t meet the minimum stay requirement (10+ stays) (Hospitable)
- 9.8% didn’t achieve Superhost status because they didn’t meet the minimum review requirement (4.8+ stars) (Hospitable)
- On average, Superhosts have a 4.9 star rating where as standard hosts have a 4.6 star rating, on average (Hospitable)
- Surprisingly, Superhosts’ nightly rate tend to be –11% less than standard hosts (Hospitable)
- That said, Superhosts earn 60% more revenue per day compared to standard hosts (Hospitable)
- 47% is the overage occupancy rate of a Superhost (Hospitable)
How is the Airbnb platform performing?
The Airbnb platform seems to be performing well, with an astounding 91 million users in one month alone.
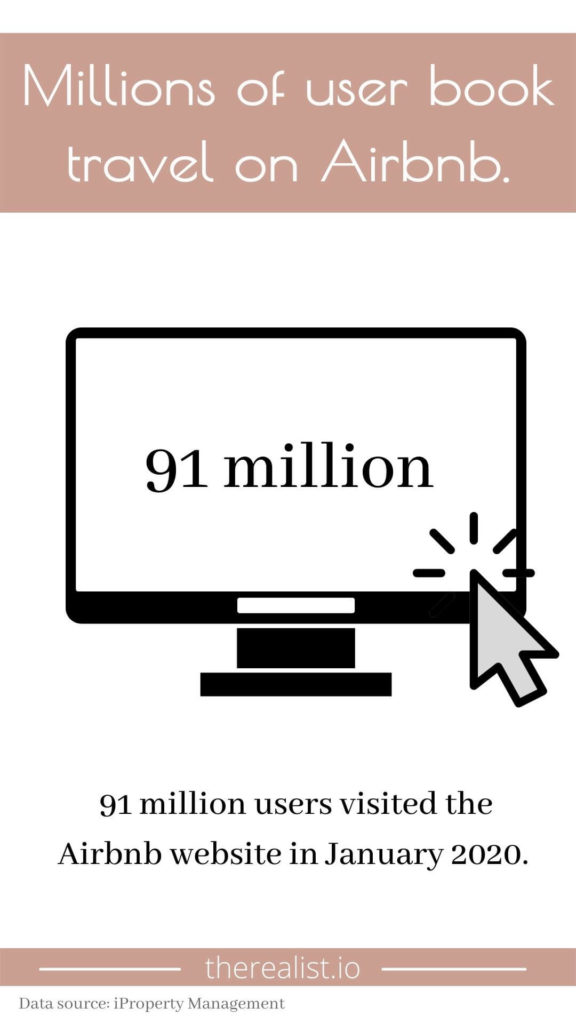
- 91 million users visited the Airbnb website in January 2020 (iProperty Management)
- 50% of user traffic to the Airbnb website in January 2020 were on mobile devices (iProperty Management)
- 11 minutes and 31 seconds is the length of time a user spends on the Airbnb app, on average (iProperty Management)
- 19% of total lodging demand in the U.S. comes through Airbnb listings (iProperty Management)
What’s the future of Airbnb?
Unfortunately, we expect to see a slight dip in overall revenue in 2022 but recovery is anticipated in 2023.
- In 2022, the average occupancy rate is expected to be 59.8%, continuing the strong trend we saw in 2021 (AirDNA)
- However, we expect to see average daily rates (ADRs) decrease -4%, due to expected changes in seasonality (peak season extending into off-season) and an increase in supply (AirDNA)
- This decrease in ADR and increase in supply will likely lead to a dip in revenue per listing (AirDNA)
- While we’ve seen remote work have a hugely positive impact on Airbnb businesses, especially as peak season has extended into shoulder season, it’s uncertain whether these new demand patterns will continue in 2022 and beyond (AirDNA)
- $56,000 became the new average revenue from Airbnb listings at the end of 2021 – the highest ever (AirDNA)
Given the expectation of increased supply and decreased average daily rate, overall revenue potential in 2022 is expected to decline by –4.8% but stabilize and increase again in 2023 (AirDNA).
Takeaway
There is so much to be learned by digging into Airbnb statistics! Armed with the Airbnb statistics covered in this post, you’re not ready to craft an exceptional Airbnb listing (or optimize your existing listing) based on who your potential guests are and what they’re looking for.
Happy hosting!
Sources
- Airbnb
- Airbnb survey
- AirDNA
- AirDNA
- AirDNA
- Nerdwallet
- iProperty Management
- The Zebra
- Hospitable
- Stratos Jets
- Much Needed
- Statista
PIN this post so you can reference it when you need it most:

What was the most surprising statistic to you? I’d love to know in the comments.
Disclaimer: All content on this website is for informational purposes only. You are taking all provided information at your own risk. We are not financial, real estate, legal, investment or other professionals. Nothing on this website should be construed as professional advice. We will not be liable for any loss or damage of any nature. For more information, read our disclaimer.


+ show Comments
- Hide Comments
add a comment